aLocal Geospatial
Data-Driven Geospatial & Research Analysts For Government Departments, Public Agencies, and Native American governance.

Guess less. Analyze more.
From the foundation of sidewalks to the tops of skyscrapers, urban/rural development and city/township planning are among some of the most challenging lines of work anyone could choose to engage in. we offer a solution — aLocal Geospatial.
Our team of highly-trained Geospatial & Research Analysts are experienced in GIS mapping, providing key data for economic development projects, and sustainable development opportunities.
We are experts in imagery and creativity, as well as presenting, planning, and guiding our clients. Our ability to manage projects, build and lead diverse teams, and collaborate cross-functionally all while helping to forward strategic planning, is second to none.
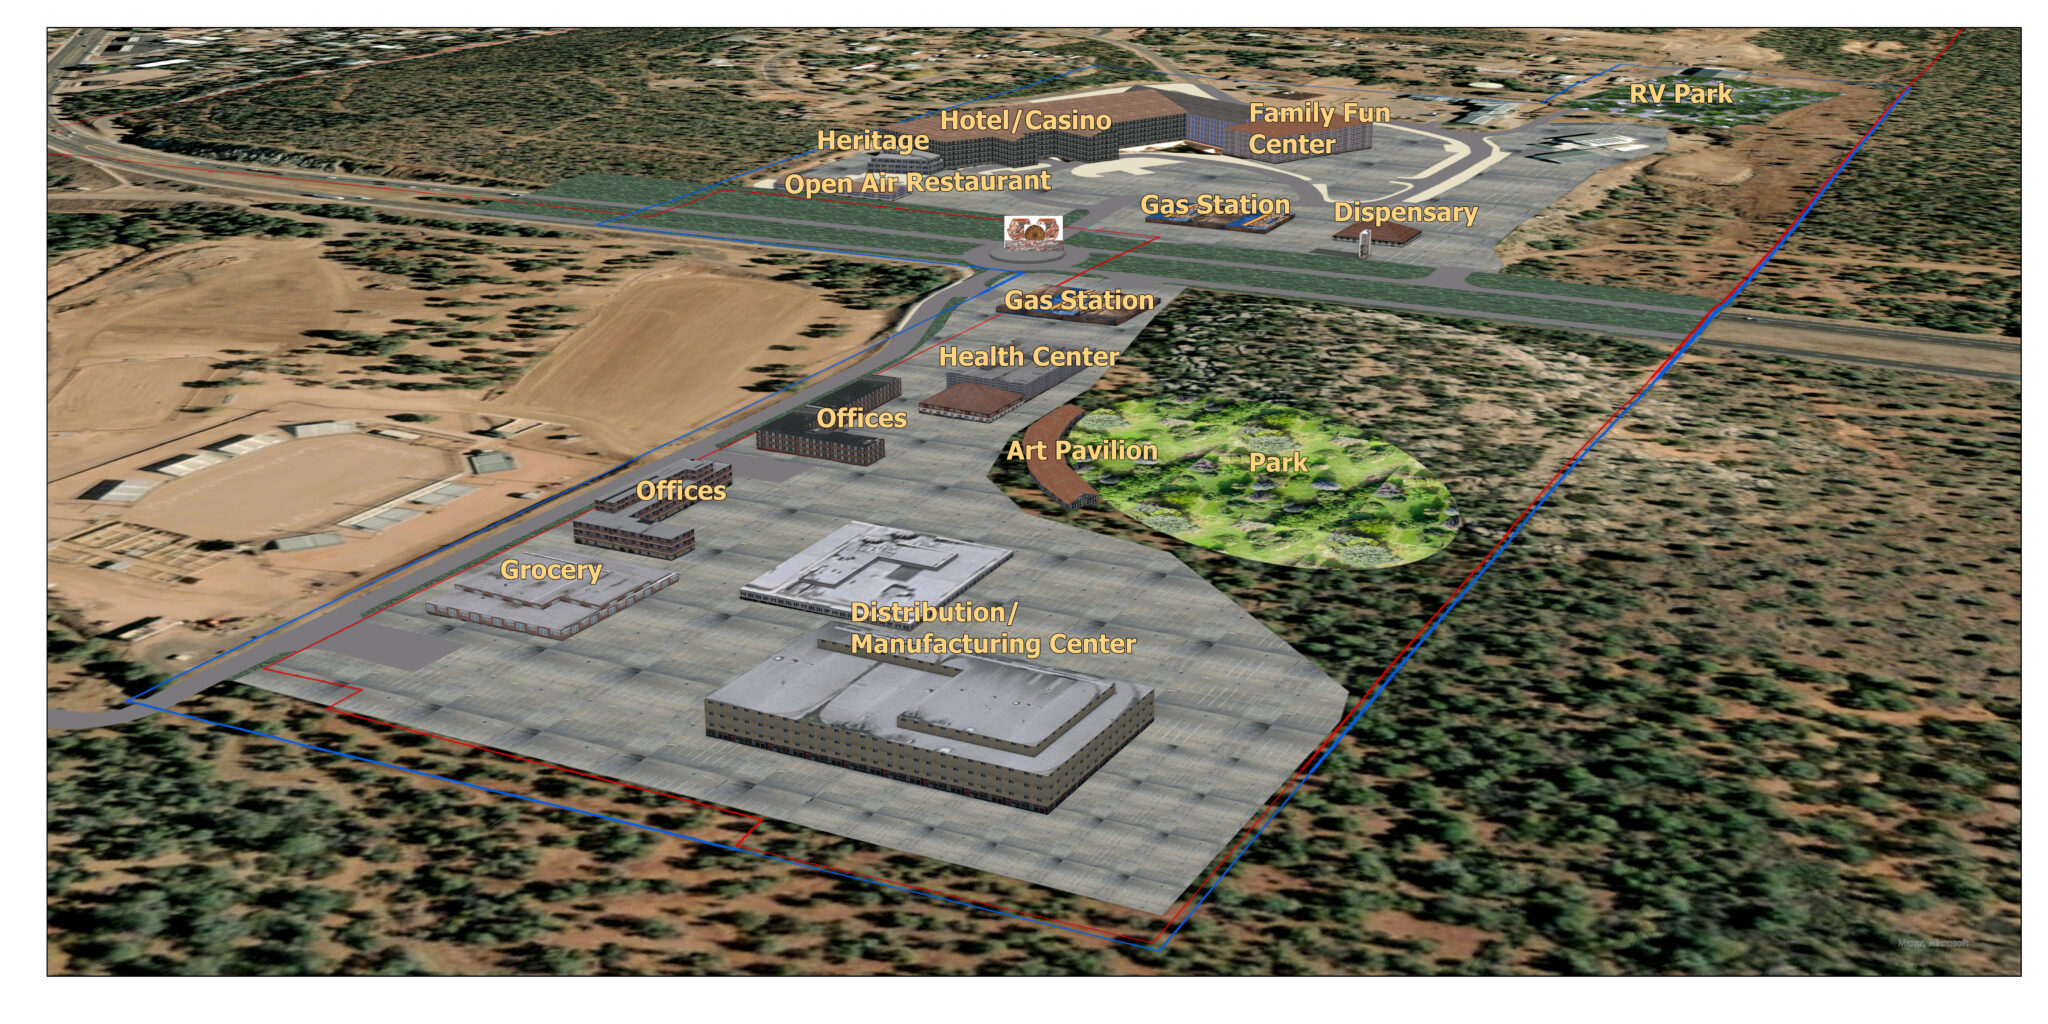
We have highly-qualified GIS researchers on projects involving economic evaluations, land use analysis, corridor planning, and feasibility studies.
Big data processing is our expertise. Wetackle any project, big or small.

CEDS (Comprehensive Economic Development Studies)

Master Plans

Water & Electrical Management Plans

Economic Impact Studies

Community Development

Economic Impact

Market Demand

Geographical Information Systems (GIS)

Tax Impacts

Planning

Use Service To Gain Insight Into Public Interests
The aLocal Government algorithm uses ZIP Code Tabulation Areas (ZCTAs) to analyze and interpret urban development and site-specific trends within a given region, city, district, or urban area of import. Data and analytics are aggregated based on a number of industry factors and parameters that encompass more than a dozen essential sectors of the economy. ZCTAs were developed by the North American Industry Classification System (NAICS) as a more reliable and efficient method for the analysis and interpretation of fiscally significant industry sectors. These 18 categories, initially organized in a high-level hierarchy, can then be further broken down by their individual characteristics and geographic specifications. Government departments, agencies, and other public-facing organizations are grouped under the ZCTA identification code “ .”
Interpret Current Urban Development Demands & Project Future City Trends
Analyze, in real time, the current consumer demand levels for casinos and gaming business activity in your given area or targeted markets. The aLocal Gaming interface allows you to see where there is and is not an industry need for casinos and related gambling businesses. With this pertinent geographic and economic insight, you can narrow down your options, more accurately segment your consumer demographics, and refine your current and future marketing strategies to reach the audiences and consumers who matter most. After all, more effective marketing is less expensive marketing. aLocal Gaming is the data-driven marketing solution that can boost your odds of winning big in your local market, today and tomorrow.

Find Ideal Budget & Options For Any Public Agency Or Frontline Organization
Determine the right solution for your Geospatial needs that not only works well for you, but also bodes well for your government department or local agency. We understand that not all public-facing organizations operate in the same way or serve the same purpose, and due to the nature of our federal tax system, every client who uses aLocal Geospatial will likely have a different, predetermined budget or limit on expenditure. Unlike bureaucracy, however, we offer a truly dynamic spectrum of service plans, many of which are designed for moderate to low price limits.
Why aLocal Geospatial?
aLocal Geospatial was created as a result of an ongoing request to provide high-end advisory services specific to market demand, economic impact and planning. Using a powerful netEI (net Economic Impact) software developed by aLocal, we are able to provide quick results at a reduced rate since the overhead is low and the software we use is incredibly powerful.
We specialize in many other related services:
- Economic Development
- Community Development
- Economic Impact
- Market Demand
- Tax Impacts
- Employment and Wage Impacts
- GDP/Value Add Impact Studies
- Planning
- Geographical Information Systems (GIS)
- Feasibility Studies
- Financial and Economic Estimates
- Master Planning
- Corridor Planning
- Land Use Planning
- Advocacy Studies

Compare Scenario Models For Market Projection and Urban Demand
Our powerful analytics allow you to see, on maps and tables, where there is current consumer demand (or where there is a less-than-favorable degree of demand) for your industry, service, and/or product. aLocal Gaming also offers a hypothetical market scenario tool equipped with a dynamic algorithm that allows you to visualize and estimate outcomes for future changes in commercial supply and market demand within a specific community, target market, or ZCTA. You can even conduct several of these tests simultaneously in order to see how different hypothetical buyer situations might impact your business location and current approach to casino marketing strategy.
Urban/Rural Prosperity Tomorrow Starts With Proactive Choices Today
Explore Government & Public Agency Solutions
Learn More About The Algorithm Powering Our Urban/Rural Planning & Development Solutions
aLocal Geospatial can provide your public or frontline organization with the right services it needs to ensure any major site or city is proactively prepared for all that’s ahead. Every city, no matter its population or location, has the ability to do great things for those who call it home — and we pledge always to do this without the crazy costs of a typical data consulting firm.
With aLocal Geospatial in your strategic toolbox, your city planning and public development efforts will be fortified by the knowledge gleaned from our platform’s dynamic combination of verifiable research data, analytic algorithms, and rapid statistical interpretation.
aLocal Geospatial owns and offers a uniquely specialized software and patented algorithm that generates reports using census data pooled from Zip Code Tabulation Areas (ZCTAs). These variables pertain to NAICS code summaries, and each of these are regressed, respectively to demographic and spatial datasets. These variables are grouped using Principal Component Analysis (PCA) and then re-regressed with the dependent variables and PCA regression variables with eigenvalues greater than 1.
